company branding logo

&Element

Dashboard Design

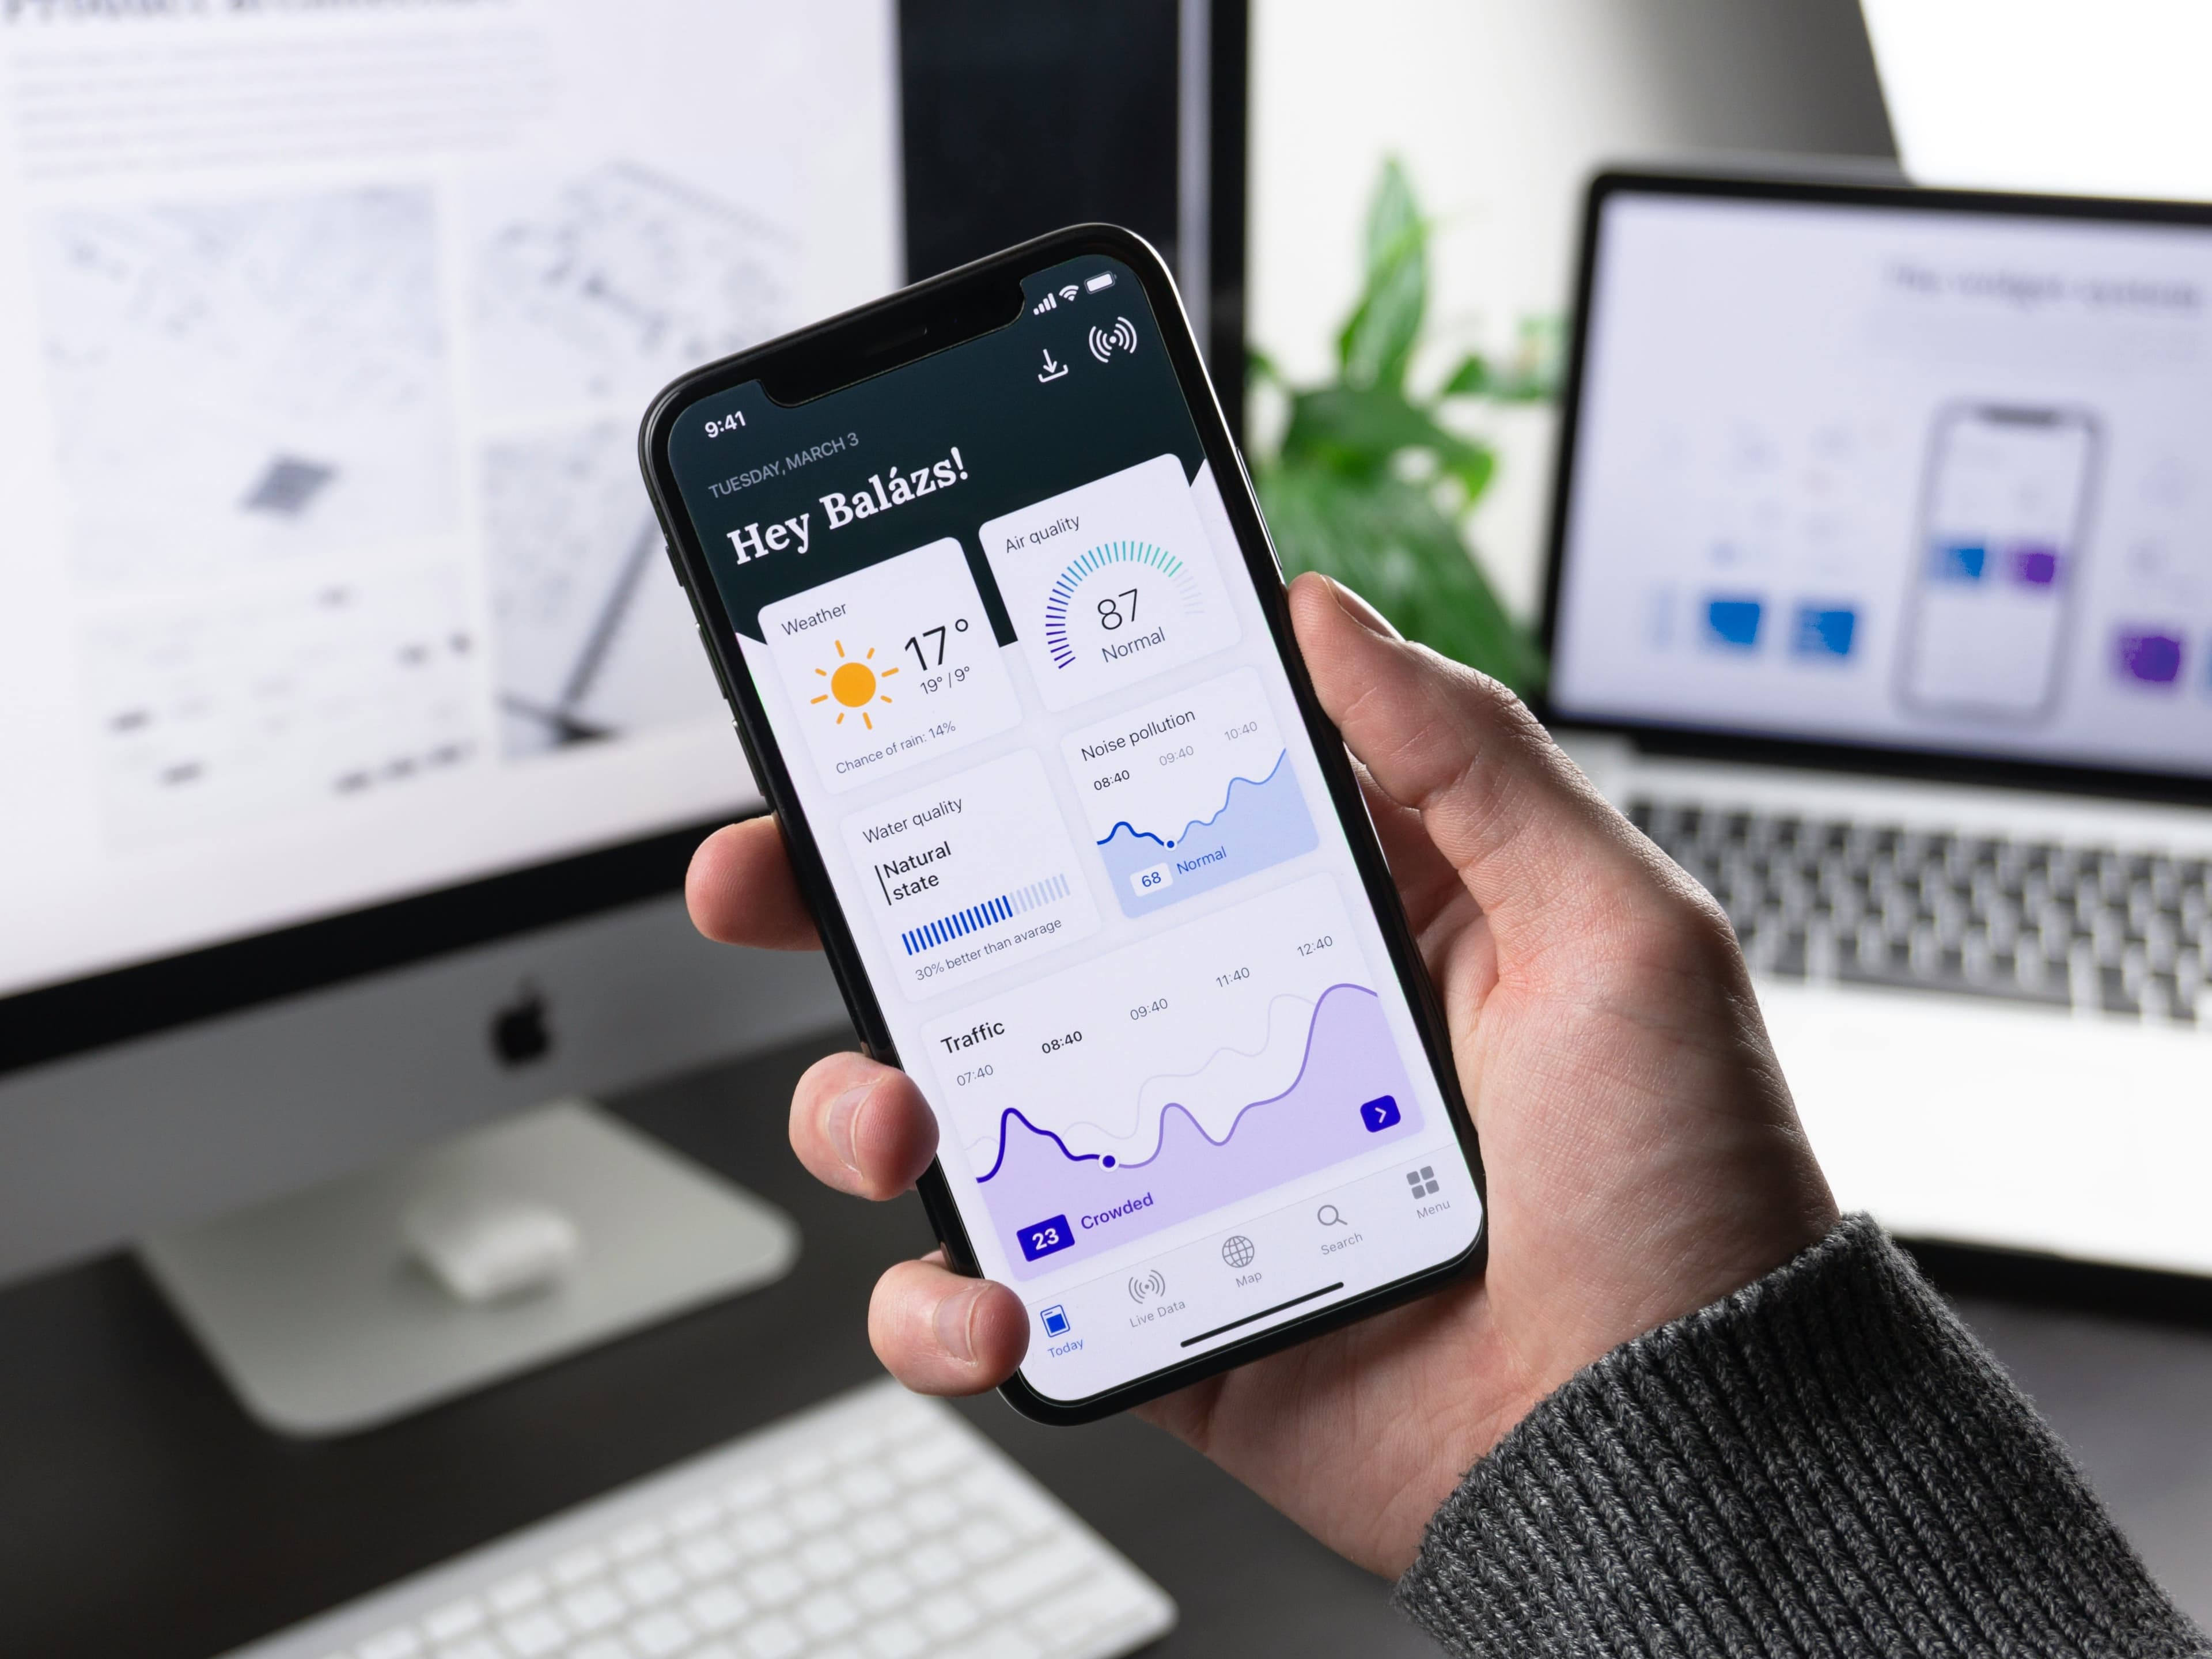
Elevate your business intelligence with &Element’s Dashboard Design services. Our bespoke dashboards are meticulously crafted to visualise your data beautifully and intuitively, ensuring you can track KPIs, glean real-time insights, and make data-driven decisions with precision and ease.

Hero image

We’ve helped hundreds of businesses digitally optimise their company and increase profits.

Our core services

UX DesignWeb DevelopmentApp DevelopmentDigital MarketingArtificial Intelligence

230% average increase in ROI across our suite of services.


235+ projects completed since we were founded in 2015.


45m people reached across the world through work.

What is dashboard design?

Dashboards are business tools that visualise important data, optimise processes and help in decision making. The goal of dashboard design is not just to make data "pretty" but to make it accessible, understandable, and actionable.

This involves a deep understanding of UI/UX principles as applied to data visualisation and requires skills in graphic design, data analysis, and possibly software development, depending on the complexity of the data integration involved. 

Content image

What are the key aspects of dashboard design?

The design of a dashboard should be tailored to its user's needs, providing them with relevant information formatted logically, prioritised according to importance, and easy to scan. This might mean customising views for different user roles or departments within a business. Modern dashboards are often interactive, allowing users to drill down into specific metrics or time frames or manipulate data variables to see different scenarios.

Consistency in design elements such as colours, layout, and typography helps make the dashboard intuitively easy to use. A practical design should adhere to established visual hierarchies that guide the viewer's eye through the data in a logical flow.

Content image

What are some real benefits of dashboard design?

Dashboard design plays a crucial role in the strategic management and operational workflows within organisations by providing a visual representation of performance metrics and actionable data. 

Effective dashboard design not only simplifies data presentation but also transforms data into actionable insights that can lead to more informed decision-making and ultimately drive improved business outcomes. The strategic use of dashboards is critical in today's data-intensive business environments.

Content image

There is so much opportunity to increase your business sales, start your journey today.

Contact us

30%

reduction in data gathering time

Time Efficiency

44%

of businesses reported increased business agility and faster decision making from the use of dashboards and analytics

Productivity Increase

2x

Companies that use analytics, including dashboards, are 2 times more likely to be in the top quartile of financial performance

Profitability Metrics

30%

Visual data discovery tools, including dashboards, have a 30% higher adoption rate than traditional business intelligence (BI) tools

User Adoption

241%

Businesses that invest in dashboard technology can see an average ROI of 241%

Return on Investment

70%

Organisations that deploy dashboards and data visualisation tools reduce the chance of human error in data handling by up to 70%

Error Reduction

Our web development process


01

Planning

The project kicks off with a comprehensive consultation to understand your business, specific needs, and objectives for the dashboard. This includes discussing the key performance indicators (KPIs), the intended users, and what decisions or actions the dashboard should inform.


02

Data Preparation

Our team collects and integrates data from specified sources, ensuring it is accurate and comprehensive. This involves setting up data pipelines and storage solutions that will feed into the dashboard. After that we create a prototype of the dashboard is created.


03

Design

In this phase, the dashboard design is refined to improve user interaction based on feedback from the initial prototype. This includes enhancing the visual elements such as charts, graphs, and gauges, and implementing advanced interactive features like drill-downs and filter options.


04

Testing

The dashboard undergoes rigorous testing with potential users to identify any usability issues or bugs. Feedback is collected to refine the dashboard’s functionality and design further.


05

Deployment

Once the dashboard is finalised and fully tested, it is deployed to your environment. This includes integrating it with existing business systems and ensuring it operates smoothly with real-time data.


Want to get a tailored process to your specific needs? Contact us now

Our web development Insights

Read all posts

University of Suffolk

Ruth Patron

Centre Manager

&Element created us an immersive brand and brand strategy for Entrepreneurs Forge. The team worked with us through many research rounds to delivery exactly what we wanted.

Cochrane Associates

Dr. Peter Cochrane OBE

Ex-CTO of BT

There is nothing like a change of career for creating a tidal wave of disruption; and after decades of leading industry, I was ready. &Element are the best I have worked with to progress this change, and therefore come with my full support and highest recommendation.

Arma Karma

Ben Smyth

CEO

We worked with &Element to create an engaging pipeline of projects over 12 months for our business. Including a marketing website, 3 customer checkouts and a staff dashboard and API integrations, &Element supported us to achieve this huge feat.

Ballen Studios

Christopher Luich

Head of Operations

&Element have been fundamental to developing our AI dashboard and other machine learning solutions. They have allowed us to achieve huge growth and modernisation in our company. Thank you for your hard work.

Ministry of Defence

Sarah Eshelby

Employability Officer

We approached &Element to build us an employability portal for our tri-service military personnel looking at gaining new skills and career opportunities. They were efficient and helpful throughout the project and we hope to work with them again.

Maekersuite

Stephanie Demetriou

Co-Founder

Thank you &Element for your hard work, professionalism and knowledgeability. Leading us over many years to build out our web dashboards and integrate advanced AI features (such as facial tracking, intelligent teleprompters, data scraping).

Featured AI development case studies

Read all case studies

Background Image
 image

React.js Development image

React.js Development

Node.js server-side development image

Node.js server-side development

Next.js. a react framework image

Next.js. a react framework

MongoDB, noSQL database image

MongoDB, noSQL database

Web Development FAQs


Dashboard design involves creating a visual representation of data that allows businesses to monitor their key performance indicators (KPIs) efficiently. Effective dashboard design helps make strategic decisions quickly, identifies trends, and highlights areas that require attention, significantly enhancing operational efficiency.

01


Any quantifiable data can be incorporated into a dashboard design. This includes sales figures, financial metrics, operational efficiencies, customer demographics, and much more. The goal is to aggregate data from various sources into a unified presentation that provides actionable insights.

02


A well-designed dashboard provides at-a-glance visibility of business performance against established metrics, enabling quick response to trends or issues as they arise. This real-time data presentation reduces the time spent analysing extensive reports, thus speeding up decision-making.

03


Effective dashboard design should be intuitive, visually engaging, and tailored to the user's needs. Key elements include simplicity, clear visual hierarchy, consistent design language, use of charts/graphs for data representation, and interactive capabilities to drill down into more detailed views.

04


The dashboard design process typically involves initial consultations to understand business needs, followed by developing a design prototype. After client feedback and adjustments, the dashboard undergoes data integration and final testing before deployment.

05


Absolutely, customisations are central to the dashboard design services provided. Tailoring dashboards to fit specific business requirements and user preferences is crucial for maximising the utility and effectiveness of the dashboard.

06


The cost can vary widely depending on the dashboard's complexity, the data sources integrated, and the level of customisation required. We encourage you to contact us if you wish to know more about our pricing.

07


Ensuring data security involves multiple layers of protection, including data encryption, secure data transfer and storage, and controlled access mechanisms. All data used in dashboard designs adhere to strict privacy standards and compliance regulations to protect client information.

08


The timeframe for designing and implementing a dashboard can range from a few weeks to several months, largely depending on the scope and complexity of the project. The initial stages involve design and feedback, followed by data integration and final refinements based on user testing.

09


An AI dashboard typically includes data visualization tools to present insights from complex datasets clearly. It often features real-time analytics, customisable widgets, and user-friendly interfaces to facilitate decision-making. Integration with various data sources and machine learning models is also common, allowing for predictive analytics and automated reporting.

10


Book a free consultation

We offer a free review of your digital presence to understand your problems and build a strategy to make you succeed online.