company branding logo

&Element

Data Visualization Services

Unlock the full potential of your data with &Element's Data Visualization Services. Our expert designers and analysts use cutting-edge tools to turn complex information into visually stunning and easy-to-understand graphics.

Hero image

We’ve helped hundreds of businesses increase profits through Data Visualization Services.

Our core services

UX DesignWeb DevelopmentApp DevelopmentDigital MarketingArtificial Intelligence

230% average increase in ROI across our suite of services.


235+ projects completed since we were founded in 2015.


45m people reached across the world through work.

What are data visualization services?

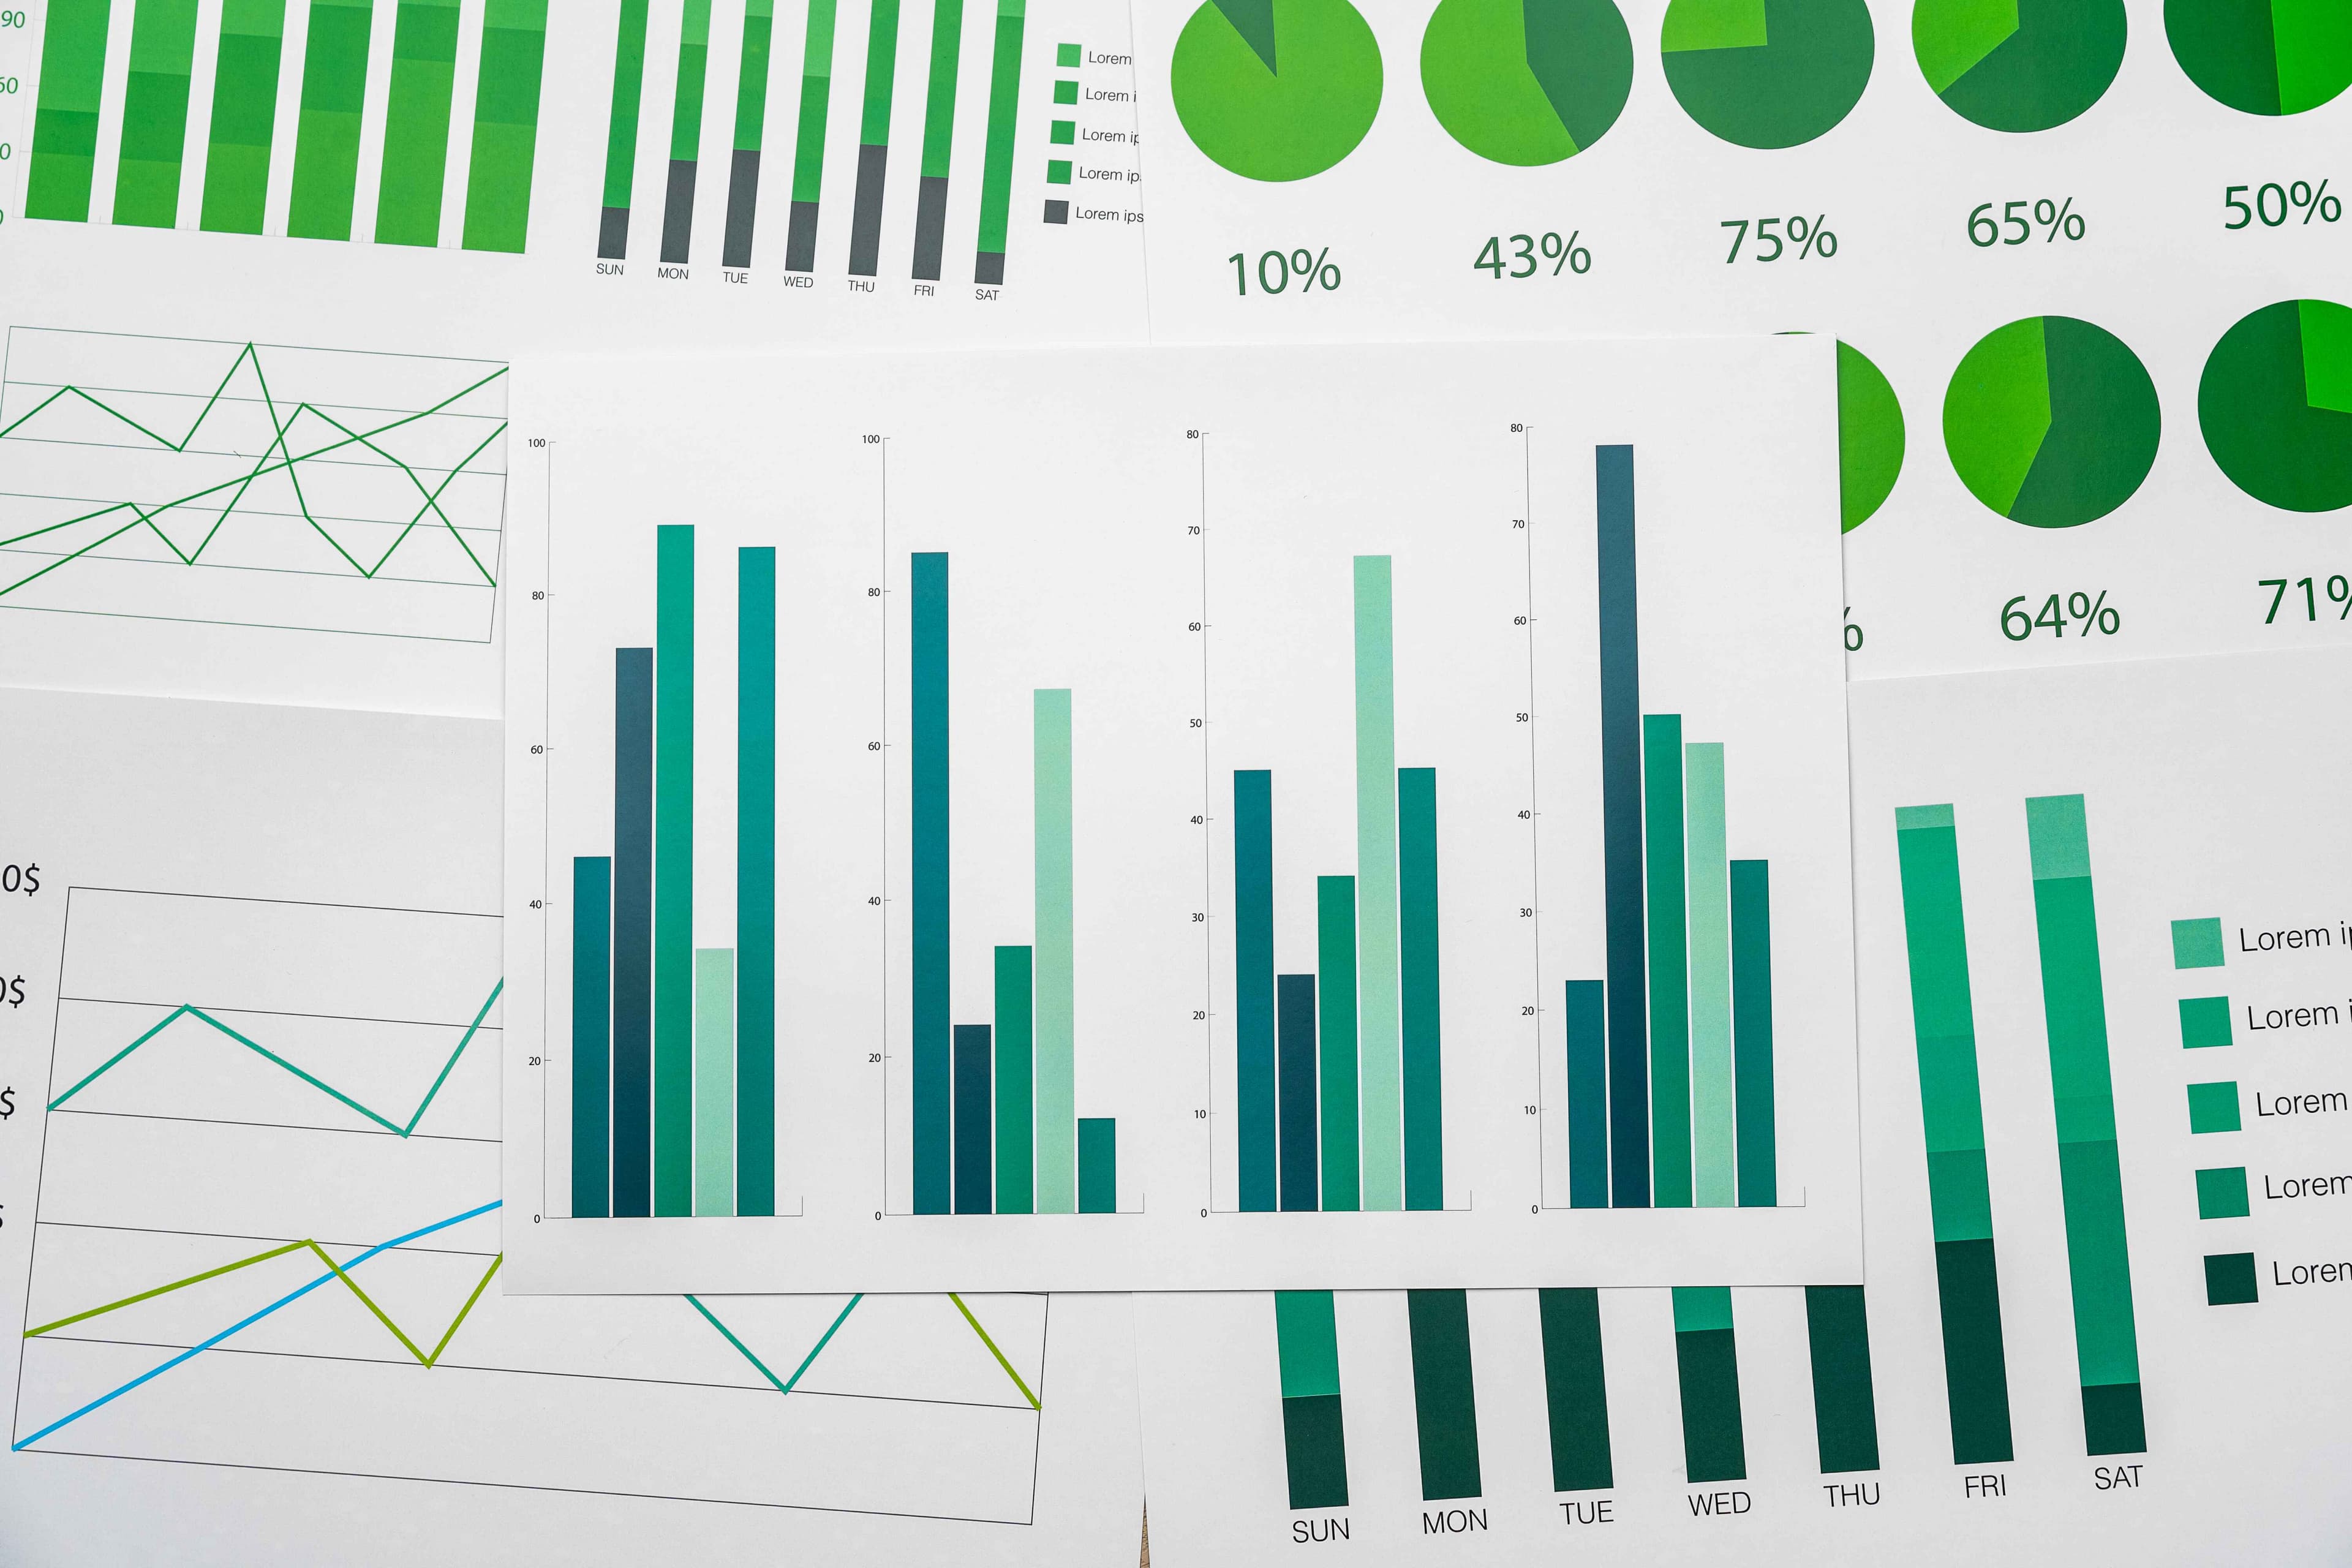
Data visualization services involve converting data from raw datasets into a graphical or pictorial format that enables decision-makers to see analytics presented visually. These services help to identify patterns, trends, and correlations that might go undetected in text-based data.

They can be crucial for businesses that need to digest large quantities of information and make decisions based on complex data sets. Here’s a closer look at what these services typically include
Content image

How can data visualization benefit business?

Data visualization services are a powerful tool for businesses as they convert vast data into easy-to-understand visual formats that help with comprehension and quick decision-making. By visually representing data, companies can more effectively identify trends, monitor changes, and uncover hidden insights which might not be apparent from raw data alone.

For example, marketing teams can use data visualizations to track customer behaviour trends over time and adjust campaigns accordingly for better performance. Financial analysts utilise complex visualizations to detect potential investment risks and opportunities by interpreting market conditions swiftly. Operational teams can monitor real-time data through interactive dashboards to manage supply chains more efficiently, ensuring timely responses to production issues or demand fluctuations.

Content image

Is data visualization powered by artificial intelligence?

Data visualization is not inherently powered by artificial intelligence, but AI can significantly enhance its tools and techniques. AI and machine learning algorithms can automate the analysis of large datasets and identify patterns or trends that would be difficult for humans to find unassisted. For example, AI can help predict future trends based on historical data, which can be crucial for creating proactive business strategies. These predictions can be incorporated into visualizations, making them more dynamic and informative.

Additionally, AI can optimise how data is displayed by suggesting the most compelling charts or graphs based on the data's characteristics. This integration of AI enhances the interactivity and utility of data visualizations, making them powerful tools for decision-making in business environments. Thus, while data visualization as a practice does not require AI, employing AI can significantly expand its capabilities and effectiveness in real-world applications.

Content image

There is so much opportunity to increase your business sales, start your journey today.

Contact us

28%

Companies that use visual data discovery tools are 28% more likely to find timely information

Better Decision Making

40%

Companies that utilise visual data tools can improve their key performance metrics by up to 40%

Improvements in Performance

50%

Data visualization supports a 50% increase in collaboration among analysts

Better Collaboration

47%

Visual data discovery tools reduce the time needed to prepare data by up to 47%

Data Preparation Time

120%

Businesses that adopt data visualization tools can experience a revenue increase ranging from 24% to 120%

Growth in Revenue

200%

According to research by IDC, organisations that use visual analytics can achieve a 100% to 200% increase in productivity

Productivity Improvements

Our data visualisation process


01

Planning

Firstly, we arrange a meeting with you to understand the project's scope, the nature of the data involved, and the key objectives of the visualization. Our team will assess the needs for the visualization, including the target audience and what decisions or actions the visualizations should inform.


02

Data Preparation

Depending on the client’s setup, &Element may assist in aggregating data from various sources, including databases, spreadsheets, or even real-time data feeds.


03

Development

Our designers create initial designs or prototypes of the visualizations. The prototypes are reviewed by the client, and feedback is incorporated into the designs.


04

Integration

The visualizations are integrated with your data systems for automatic updating, or with web and mobile platforms, ensuring they can be accessed conveniently by users


05

Launch and Maintenance

The visualizations are deployed to the live environment where they will be accessed by users. After deployment, we provides ongoing support and maintenance.


Want to get a tailored process to your specific needs? Contact us now

Our AI development Insights

Read all posts

Building Smarter Apps: The Role of Machine Learning in App Development image

Agata Wisniewska

Building Smarter Apps: The Role of Machine Learning in App Development

University of Suffolk

Ruth Patron

Centre Manager

&Element created us an immersive brand and brand strategy for Entrepreneurs Forge. The team worked with us through many research rounds to delivery exactly what we wanted.

Cochrane Associates

Dr. Peter Cochrane OBE

Ex-CTO of BT

There is nothing like a change of career for creating a tidal wave of disruption; and after decades of leading industry, I was ready. &Element are the best I have worked with to progress this change, and therefore come with my full support and highest recommendation.

Arma Karma

Ben Smyth

CEO

We worked with &Element to create an engaging pipeline of projects over 12 months for our business. Including a marketing website, 3 customer checkouts and a staff dashboard and API integrations, &Element supported us to achieve this huge feat.

Ballen Studios

Christopher Luich

Head of Operations

&Element have been fundamental to developing our AI dashboard and other machine learning solutions. They have allowed us to achieve huge growth and modernisation in our company. Thank you for your hard work.

Ministry of Defence

Sarah Eshelby

Employability Officer

We approached &Element to build us an employability portal for our tri-service military personnel looking at gaining new skills and career opportunities. They were efficient and helpful throughout the project and we hope to work with them again.

Maekersuite

Stephanie Demetriou

Co-Founder

Thank you &Element for your hard work, professionalism and knowledgeability. Leading us over many years to build out our web dashboards and integrate advanced AI features (such as facial tracking, intelligent teleprompters, data scraping).

Featured AI case studies

Read all case studies

No case studies found...

Background Image
 image

React.js Development image

React.js Development

Node.js server-side development image

Node.js server-side development

Next.js. a react framework image

Next.js. a react framework

MongoDB, noSQL database image

MongoDB, noSQL database

Web Development FAQs


Data visualization is the graphical representation of information and data. By using visual elements like charts, graphs, and maps, data visualization tools provide an accessible way to see and understand trends, outliers, and patterns in data.

01


Data visualization helps businesses to make decisions based on analysed data, providing insights that can help to identify new opportunities, drive business strategy, and improve customer experience. It makes complex data more accessible, understandable, and usable.

02


We can create a wide range of data visualizations including, but not limited to, bar charts, line graphs, pie charts, scatter plots, heat maps, infographics, interactive dashboards, and geographic maps.

03


Data visualization simplifies complex data sets to provide users with at-a-glance awareness of current performance and emerging trends. This visual processing allows users to comprehend huge amounts of data, compare different pieces of data, and draw conclusions quickly and effectively.

04


Based on the project's requirements, we utilise various tools, including Tableau, Microsoft Power BI, Qlik, D3.js, Google Charts, and high-powered databases, to handle big data sets efficiently.

05


Yes, we specialise in integrating data visualizations into existing platforms and can embed interactive dashboards and reports into almost any website or application. We ensure that your data flows seamlessly from the source through to visualization.

06


Our data visualization process includes initial consultations to define your needs, design and development of visualizations, and continuous iterations based on feedback. The final phase involves deploying the visualizations in your preferred format and platform.

07


We adhere to strict data processing protocols to clean and validate data before it is used for visualization. Our development process includes thorough testing phases to ensure accuracy and functionality. We also train our clients on how to interpret these visualizations correctly.

08


The cost varies depending on the complexity of the data, the type of visualizations needed, and the level of customisation required. We provide detailed quotes after initial consultations to understand your specific needs.

09


The timeline can vary widely depending on the scale and complexity of the project. Simple projects might take a few weeks, while more complex projects requiring intricate visualizations and large datasets might take several months.

10


Book a free consultation

We offer a free review of your digital presence to understand your problems and build a strategy to make you succeed online.