company branding logo

&Element

Data Analytics Dashboards

Unlock the full potential of your data with &Element's Data Analytics Dashboard Services. Our expert data scientists and analysts utilise cutting-edge tools to create customised, interactive dashboards that provide you with real-time insights and actionable intelligence. Dive deeper into your data and transform insights into action today.

Hero image

We’ve helped hundreds of businesses digitally optimise their company and increase profits.

Our core services

UX DesignWeb DevelopmentApp DevelopmentDigital MarketingArtificial Intelligence

230% average increase in ROI across our suite of services.


235+ projects completed since we were founded in 2015.


45m people reached across the world through work.

What is a data analytics dashboard?

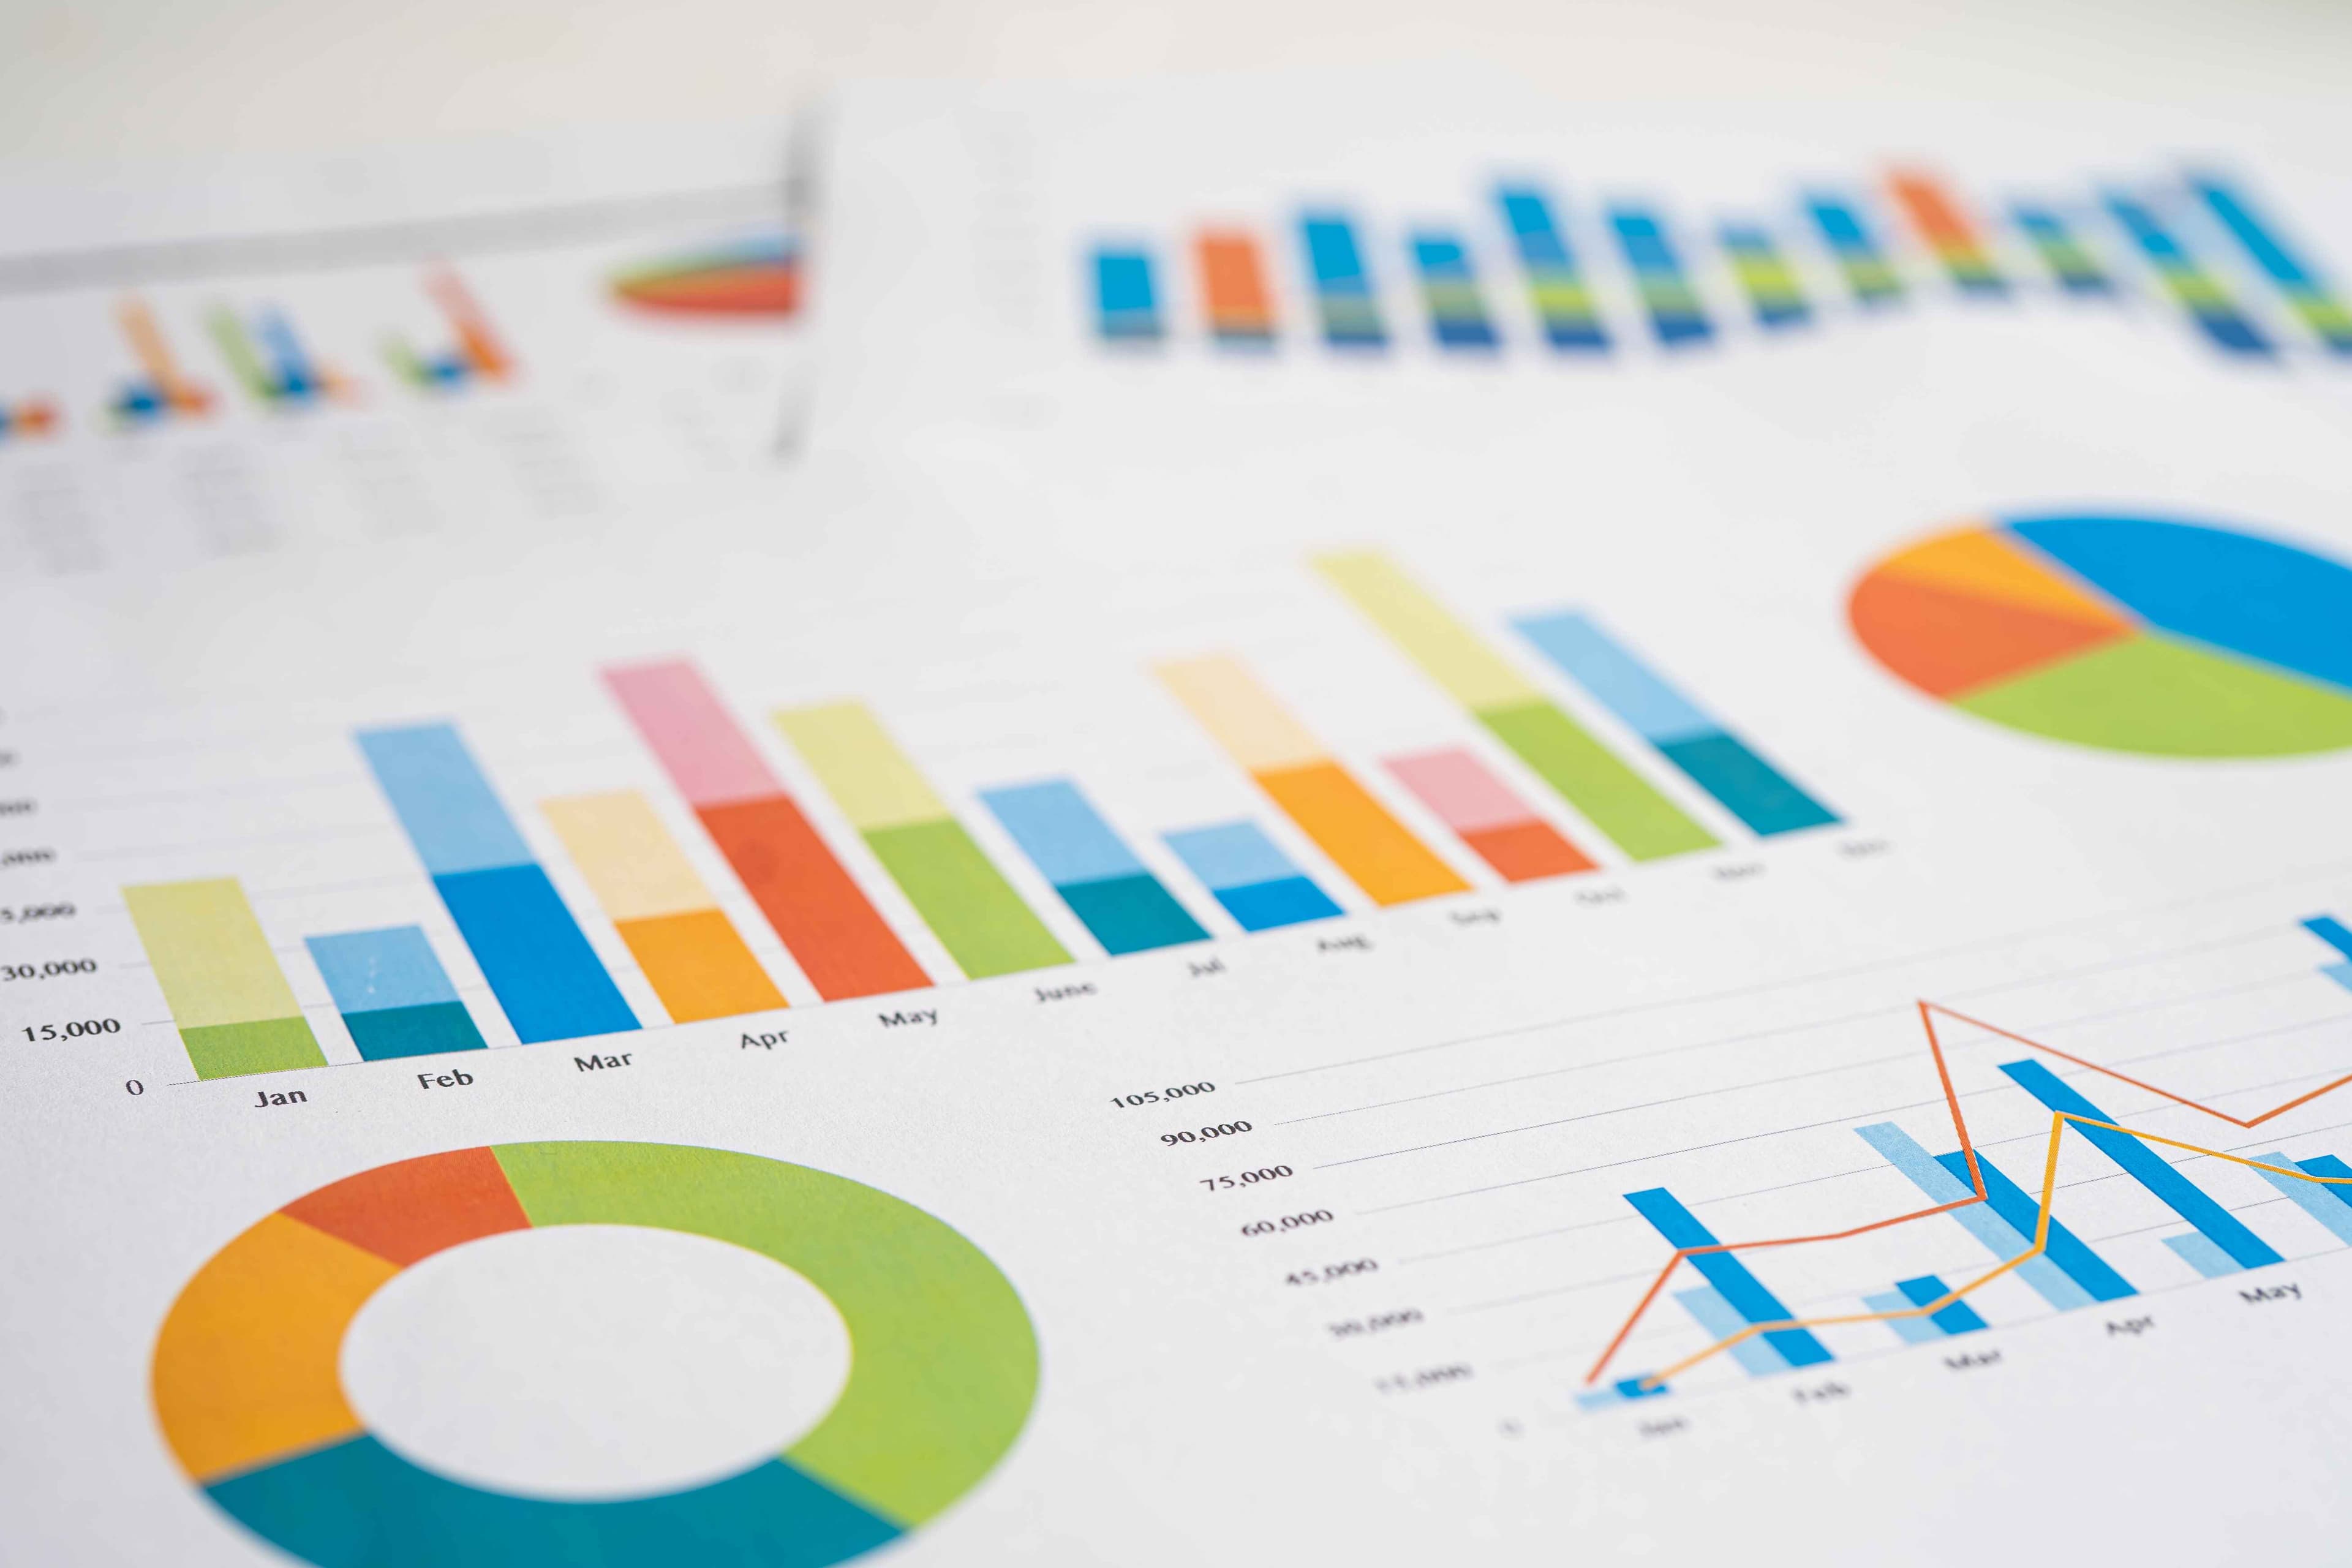
A data analytics dashboard is a tool used to visually track, analyse, and display key performance indicators (KPI), metrics, and critical data points to monitor the health of a business, department, or specific process. They are customisable to meet the particular needs of a department or company.

More advanced dashboards can provide real-time data streaming and interactive capabilities, allowing users to manipulate variables to see different scenarios, effectively use predictive analytics, and drill down into deeper analyses. This tool is invaluable across various industries, including finance, marketing, logistics, and healthcare, and it aids in streamlining processes, optimising strategies, and improving efficiency by turning data into actionable insights.
Content image

How can a data analytics dashboard benefit business?

A data analytics dashboard is crucial for businesses as it aggregates vast amounts of data and presents it in an easy-to-understand, graphical format, allowing for quick, informed decision-making. By consolidating data from multiple sources onto a single screen with real-time updates, analytics dashboards reduce the time and complexity involved in analysing large datasets.

They enable businesses to continuously monitor performance across various metrics, identify trends, and respond to real-time changes. This immediate accessibility to data helps optimise operations, enhance customer satisfaction through better service delivery, and increase revenue by identifying key growth areas. Additionally, dashboards support the detection of anomalies and potential issues before they escalate, ensuring that businesses can maintain operational efficiency and reduce risk.

Content image

What businesses can benefit from a data analytics dashboard?

Retail businesses use dashboards to track sales performance, customer preferences, and inventory levels to optimise their product offerings and marketing strategies. E-commerce platforms leverage them to monitor user engagement, conversion rates, and online transaction issues to enhance customer experiences and boost sales. 

Healthcare providers implement dashboards to monitor patient metrics, treatment outcomes, and resource allocation for better healthcare delivery. Financial institutions utilise them for real-time tracking of financial metrics such as expenditures, revenue streams, and investment performance, which aids in risk management and compliance. Marketing agencies use dashboards to track campaign results, audience engagement, and ROI to refine strategies. Each industry can tailor the use of data analytics dashboards to fit specific needs, enhancing operational efficiency and enabling better decision-making based on empirical data.


Content image

There is so much opportunity to increase your business sales, start your journey today.

Contact us

78%

of businesses report that data analytics dashboards have improved the accessibility of data within their organisations

Increased Data Availability

1.5h

Organisations using analytics dashboards save on average 1.5 hours per day per user from reporting processes

Time Saving

84%

of corporate executives consider the ability to extract strategic insights from data as a key competitive differentiation

Improved Decision Making

60%

Companies that invest in big data and analytics tools like dashboards can improve their profit margins by 60%.

Return on Investment

54%

Dashboards help 54% of businesses improve their customer relationships and customer satisfaction

Customer Satisfaction

67%

of small and medium-sized businesses that use data analytics dashboards gain better control over strategic choices and operational adjustments.

Strategic Insight

Our data analytics development process


01

Planning

Initially we plan a meeting with you to understand the specific needs, goals, and objectives of the dashboard. We will discuss what metrics are important to you, the source of the data, and the desired functionalities of the data analytics dashboard.


02

Data Preparation

Depending on your data infrastructure, our team may assist in integrating data from various sources, whether they are on-premises databases, cloud storage, or external APIs.


03

Development

Our designers create a prototype of the dashboard, which includes layout drafts and mock-ups of data visualisations. We use your feedback to refine the dashboard design.


04

Integration

The dashboard is integrated with the your data systems to ensure it can pull the necessary data automatically. We ensures that this integration is seamless, with strong attention to security and data integrity.


05

Launch

After testing, the dashboard is deployed to your environment. We oversee the deployment process, ensuring there are no disruptions to existing processes. After deployment, we offers ongoing support and maintenance services, which include regular updates, adding new features, and scaling the dashboard as your business grows and evolves.


Want to get a tailored process to your specific needs? Contact us now

Our web development Insights

Read all posts

University of Suffolk

Ruth Patron

Centre Manager

&Element created us an immersive brand and brand strategy for Entrepreneurs Forge. The team worked with us through many research rounds to delivery exactly what we wanted.

Cochrane Associates

Dr. Peter Cochrane OBE

Ex-CTO of BT

There is nothing like a change of career for creating a tidal wave of disruption; and after decades of leading industry, I was ready. &Element are the best I have worked with to progress this change, and therefore come with my full support and highest recommendation.

Arma Karma

Ben Smyth

CEO

We worked with &Element to create an engaging pipeline of projects over 12 months for our business. Including a marketing website, 3 customer checkouts and a staff dashboard and API integrations, &Element supported us to achieve this huge feat.

Ballen Studios

Christopher Luich

Head of Operations

&Element have been fundamental to developing our AI dashboard and other machine learning solutions. They have allowed us to achieve huge growth and modernisation in our company. Thank you for your hard work.

Ministry of Defence

Sarah Eshelby

Employability Officer

We approached &Element to build us an employability portal for our tri-service military personnel looking at gaining new skills and career opportunities. They were efficient and helpful throughout the project and we hope to work with them again.

Maekersuite

Stephanie Demetriou

Co-Founder

Thank you &Element for your hard work, professionalism and knowledgeability. Leading us over many years to build out our web dashboards and integrate advanced AI features (such as facial tracking, intelligent teleprompters, data scraping).

Featured AI development case studies

Read all case studies

Background Image
 image

React.js Development image

React.js Development

Node.js server-side development image

Node.js server-side development

Next.js. a react framework image

Next.js. a react framework

MongoDB, noSQL database image

MongoDB, noSQL database

Data Analytics Dashboard FAQs


A data analytics dashboard is a visual representation tool that displays an organisation's current status of metrics and key performance indicators (KPIs). It consolidates and arranges numbers, figures, and performance scorecards on a single screen and is customisable to meet the specific needs of any business department.

01


Data analytics dashboards help businesses make informed decisions by providing insights at a glance. They allow for the monitoring of business performance in real time, help identify trends, facilitate the discovery of insights, reduce the time spent analysing data, and can significantly enhance the decision-making process.

02


Virtually any type of data can be integrated into a dashboard, including sales statistics, marketing analytics, financial figures, operational costs, and human resources metrics. The key is that data must be quantifiable and consistently recorded to track trends over time.

03


We use a variety of tools to build data analytics dashboards depending on the project's requirements and the client's infrastructure. Popular tools include Tableau, Microsoft Power BI, Qlik Sense, and Google Data Studio. Each has unique features that can be tailored to meet specific visualisation needs.

04


Security is a top priority in dashboard development. We implement several layers of security including data encryption, secure data transfer protocols, and compliance with GDPR and other relevant legislation. Access controls and authentication measures are also put in place to ensure that only authorised users can view the dashboard.

05


Absolutely! Customisation is one of the key features of our dashboard services. You can customise the layout, the type of charts and graphs used, the data displayed, and even the interactive elements within the dashboard to suit your specific business needs.

06


The frequency of data updates depends on the client's needs and the specific dashboard setup. We can configure dashboards to update in real-time or at scheduled intervals—be it daily, weekly, or monthly. This ensures you are looking at the most current data whenever you check the dashboard.

07


The development process typically follows these steps: initial consultation to understand business needs, data assessment, dashboard design, dashboard development, testing, deployment, and ongoing support and maintenance.

08


The development time can vary greatly depending on the complexity of the dashboard and the cleanliness of the data sources. Simple dashboards can be developed in a few weeks, while more complex ones might take several months to fine-tune and fully integrate.

09


Yes, we provide comprehensive training sessions for all dashboards we develop. These sessions help your team understand how to use the dashboard effectively, interpret the data correctly, and make the most out of its functionalities. We also provide detailed documentation that can be referred to at any time.

10


Book a free consultation

We offer a free review of your digital presence to understand your problems and build a strategy to make you succeed online.